Exploring data
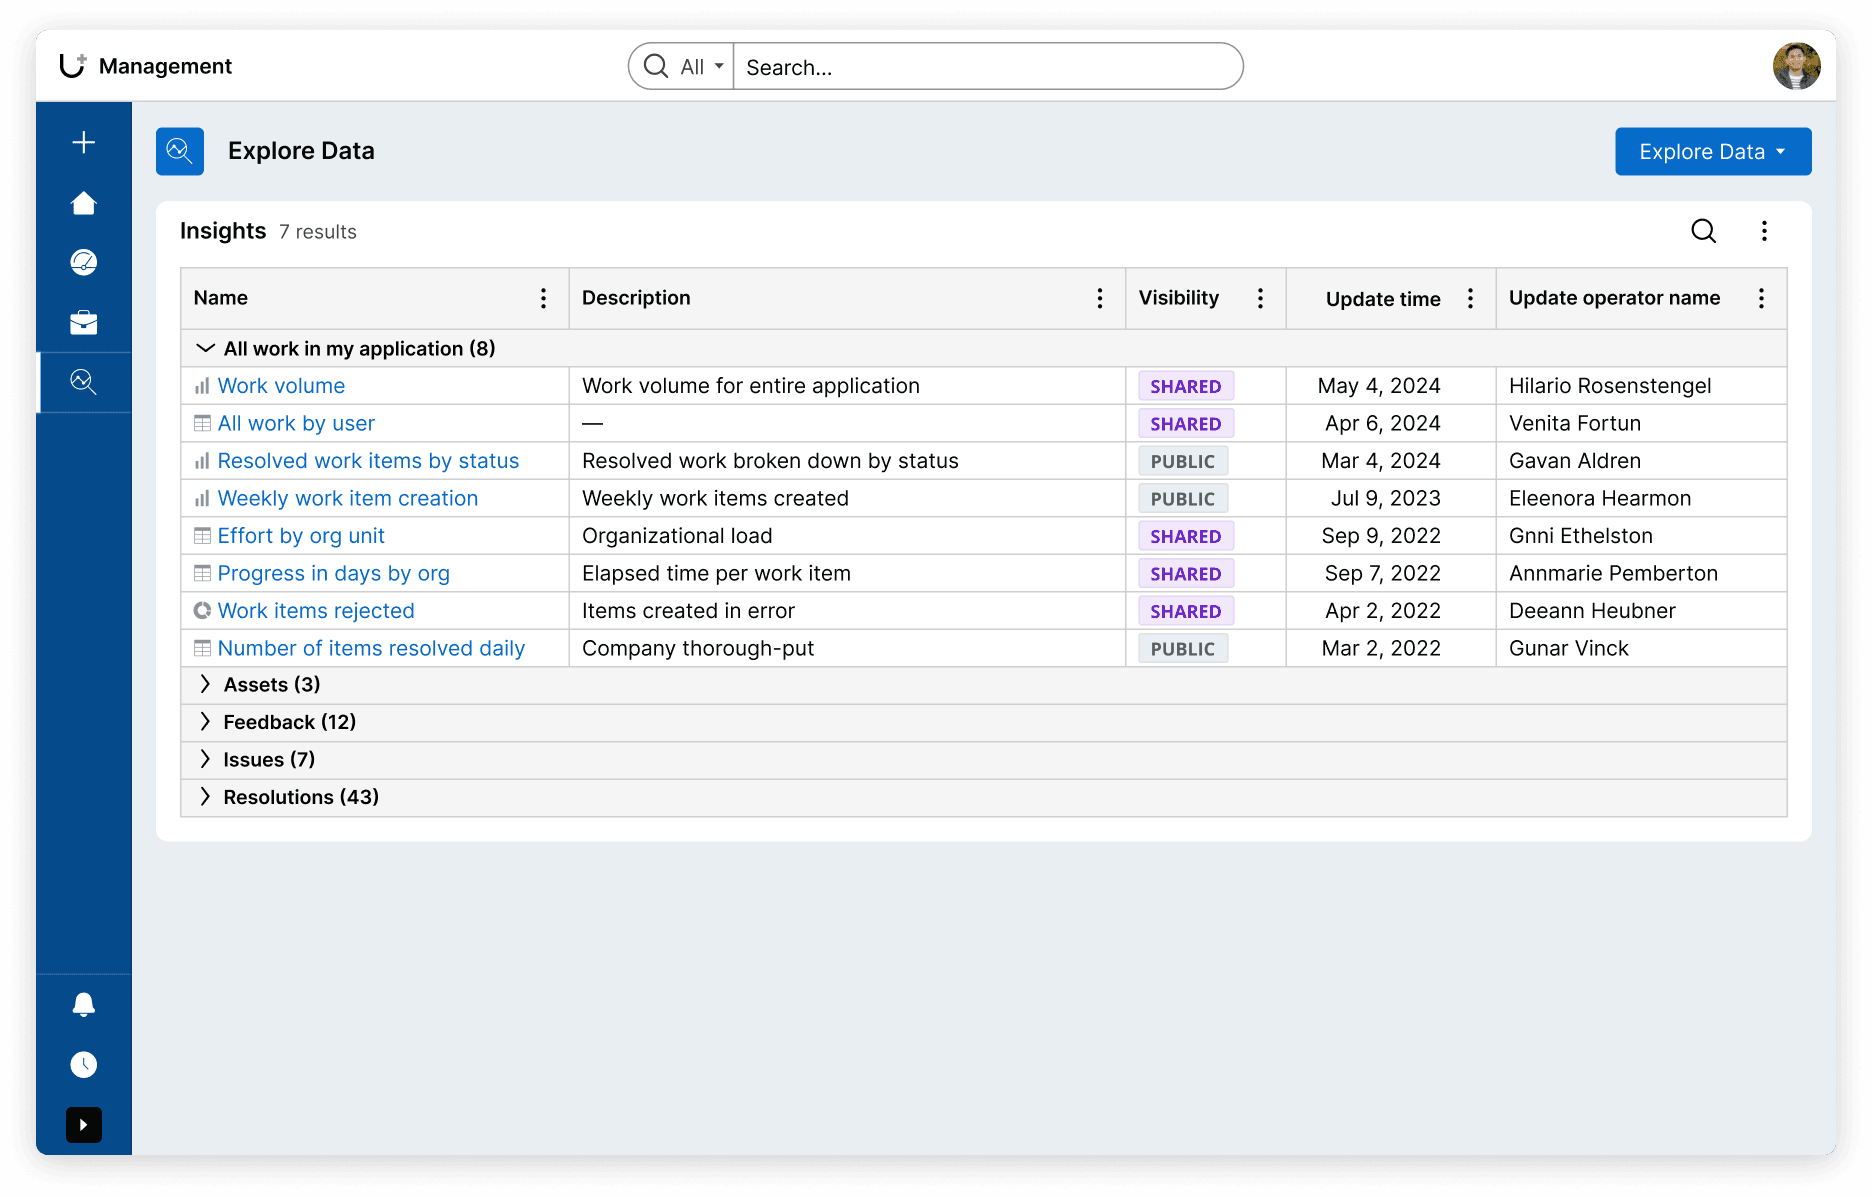
Users may want to use application data (e.g., metrics on assignments, bugs, sales, etc.) to create and analyze charts. The Explore Data page lets users filter, sort, and group data in your application to create “Insights,” or visual depictions of data that reveal valuable information.
The Constellation design system offers a variety of methods to visualize data, including area, bar, pie, donut, and column charts.